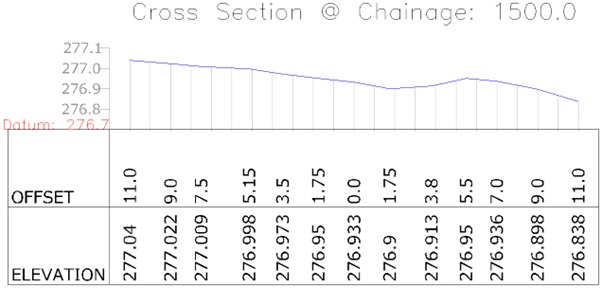
Cross sections data generation is a crucial step in many construction and infrastructure development projects. It is used in various industries such as mining, roads, railways, airports, real estate development, and more. The cross section data collected is used to create the profile of the terrain at a specific location. This data can be used to calculate the volume of earth that needs to be moved during construction, determine the slope of the terrain, and identify any potential hazards such as steep inclines. In addition to these construction-related applications, cross section data can also be used for other purposes such as land-use planning, and natural resource management. The data collection process can vary depending on the specific site and project.
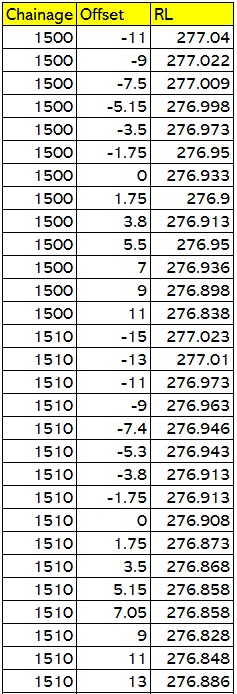
Generally surveyors and engineers use auto-level for section data collection. Auto-level is a surveying instrument that is used to measure the elevation of a specific point with high precision. It is typically used in situations where the elevation of a point needs to be determined with greater accuracy than what can be achieved using other surveying methods. The data collected using an auto-level is typically in the format of Chainage, Offset, and Elevation (COZ). Chainage is the distance from a reference point along a defined alignment, Offset is the distance between a point and the centerline of the alignment and Elevation is the vertical distance of a point above or below a reference surface.
By using auto-level to collect COZ data, surveyors are able to generate precise cross sections and quantities, which are essential for construction and infrastructure development projects.
This data can be directly imported into AutoPlotter to generate longitudinal and cross sections.
In some cases, surveyors use total stations, GPS, or similar instruments too to collect data. Such data is stored in Northing, Easting, and Elevation format. This data can then be used to generate a variety of outputs, such as contours, topography maps, surface-based volume calculations, and other DTM (Digital Terrain Model) based outputs.
AutoPlotter is a software that can convert this XYZ data into cross-sectional profiles, also known as section data (COZ).
Section Data Generation
Cross Section data generation from XYZ format can be done in many ways in AutoPlotter:
From DTM
One of the methods that the software can do this is by creating a digital terrain model (DTM) from the XYZ points imported into it. Once the DTM is generated, AutoPlotter can then create cross-sectional profiles at fixed or variable offset intervals.
For fixed offset intervals, the elevation values are generated at regular intervals such as -10, -8, -6, -4, -2, 0, 2, 4, 6, 8, 10. This means that the software will create cross-sectional profiles at these specific distances from the centerline of the alignment. This is useful for creating standard cross-sectional profiles that can be used for comparison or analysis.
For variable offset intervals, the user can provide the specific offset values at which the cross-sectional profiles should be generated. This is useful for creating custom cross-sectional profiles that can be used for specific design or analysis needs.
The elevation values obtained from both fixed and variable offset intervals are based on the triangular interpolation of the DTM. This means that the software uses the XYZ data to create a triangular mesh that represents the terrain and then uses the mesh to calculate the elevation values at the specified offset intervals.
From Plan
In addition to generating section data from a digital terrain model (DTM), as explained above, AutoPlotter also allows for the generation of section data from plan. This method is particularly useful for corridor surveys, such as those conducted for road or railway projects.
During a corridor survey, surveyors typically identify specific points along the alignment, such as the right and left edges of an existing road, and assign codes to them. For example, they may use the code “RR” for the right edge of an existing road at each chainage, and “RL” for the left edge. These codes allow the surveyors to easily identify and track specific points along the alignment.
When generating section data from plan in AutoPlotter, the software uses the codes assigned to the points during the survey to interpolate the data along the selected line. This means that instead of using the triangular interpolation method as explained above, the software uses the codes to determine the elevation of the points along the alignment.
This method of section data generation is useful for corridor surveys because it allows the surveyors to quickly and easily generate cross-sectional profiles of the terrain along the alignment. It also eliminates the need for triangulation, which can be time-consuming and complex.
Section based on actual survey data
In addition to generating section data from a digital terrain model (DTM) or from plan, AutoPlotter also allows for the generation of section data based on actual survey data collected using instruments such as total station or GPS. Instead of using auto-level, surveyors use TS or GPS as auto-level for want of speed and ease of data collection and recording.
When generating section data using this method, the software uses the recorded elevation values as they are, and does not interpolate them. This means that the software will use the exact elevation values that were recorded during the survey, rather than estimating them based on triangulation or linear interpolation, as was explained above.
This method of section data generation is useful because it allows the surveyors to use the actual elevation values collected using high precision. It also eliminates the need for interpolation, which may not generate results as per the site.
All of the methods of cross section data generation that have been discussed above, including generating section data from a digital terrain model (DTM), from plan, and based on actual survey data, were explained in detail in a recent webinar. The webinar covered the various features and capabilities of AutoPlotter software, and provided an in-depth look at how to use the software to generate accurate and precise cross-sectional profiles of the terrain:


